In previous posts I explained why the Green Peas are really unique in the local universe, and why they are great analogs for galaxies in an early universe. I also explained that Lyman α (or Lyα), a spectral line seen at 1216 Å, contains a lot of information about the gas in galaxies. It is especially sensitive to the gas inflows and outflows that fuel or slow star-formation. But, it has been challenging to interpret the feature. Lyα is not commonly seen in emission from nearby galaxies, but is increasingly common from galaxies in an earlier universe. Therefore, in order to understand the conditions that drive this evolution, it makes a lot of sense to carry out a detailed investigation of the Lyα from Green Peas. This is what I have done in Henry et al. (2015).
And these are the spectra that we observe:
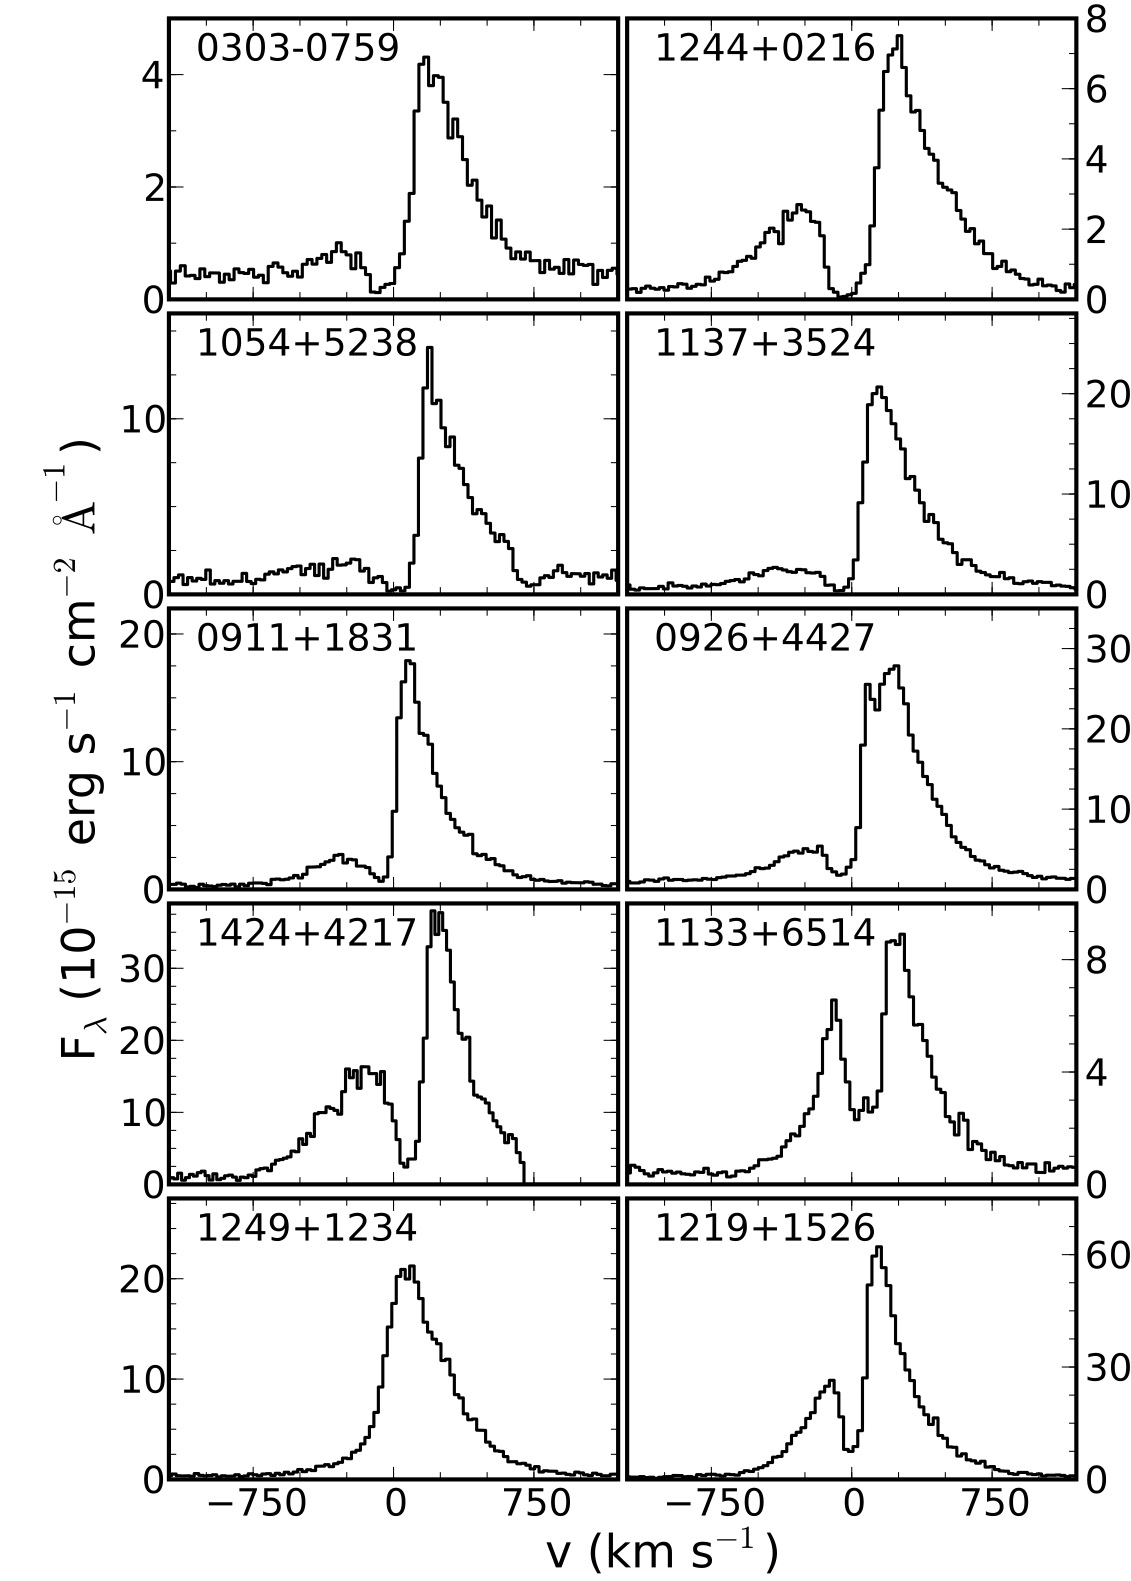
These spectra tell us some pretty interesting things, allowing us to figure out some of the astrophysics that is shaping these Lyα profiles. Here are some noteworthy observations from this figure:
- When we measure the Lyα luminosity and equivalent width, the Green Peas really stand out among nearby galaxies. They are the only local population that has Lyα in the same range as high-redshift (z≥2) Lyα selected galaxies (also known as LAEs).
- The profile shapes are remarkably similar, at least for 9/10 of the galaxies where there are both red and blue peaks. Again, this similarity is in contrast to most galaxies observed at either low or high-redshift. Recall, in my last post I showed Lyα profiles of another sample of nearby galaxies, and there was much more diversity in line shape.
- The presence of a blue peak is actually quite significant; it indicates that the column density of HI gas must be low. Otherwise there would be blue absorption instead of emission.
- In the figure above, the spectra are sorted by the fraction of Lyα photons, which, after creation in the HII regions of the galaxies, then escape and are observed by us. So going from left to right and then top to bottom, we have 0303 having the lowest escape fraction, 1244 is the second lowest, and 1219 is the largest escape fraction. We see notable trends in the profile shape along this sequence. First, the low escape fraction galaxies tend to have some absorption around the systemic velocity, while the high escape fraction galaxies tend to have emission. Second, in fact, the velocity separation between the red and blue peaks shows a tight correlation with the fraction of escaping Lyα flux.
The last point is key to understanding the astrophysics. Remember, the Lyα is injected as a symmetric, Gaussian profile. What we are seeing though, is that the intrinsic line profile is being eaten away, center first. This turns out to be a strong indication that HI column density is the dominant factor regulating how much Lyα we are able to see.
We also explored other possibilities for the mechanisms that decide how Lyα escapes. But there are no other convincing explanations. In detail:
- The Green Peas all have similar, extremely low dust extinction. So we cannot explain the variation in their Lyα by a range of dust extinctions.
- One hypothesis that I suggested in my previous post was that Lyα escapes by scattering in an outflow, which allows the photons to pick up a Doppler shift and be emitted out of resonance with the interstellar medium of their host galaxy. Indeed, the UV spectra of the Green Peas have absorption lines from their gas outflows.

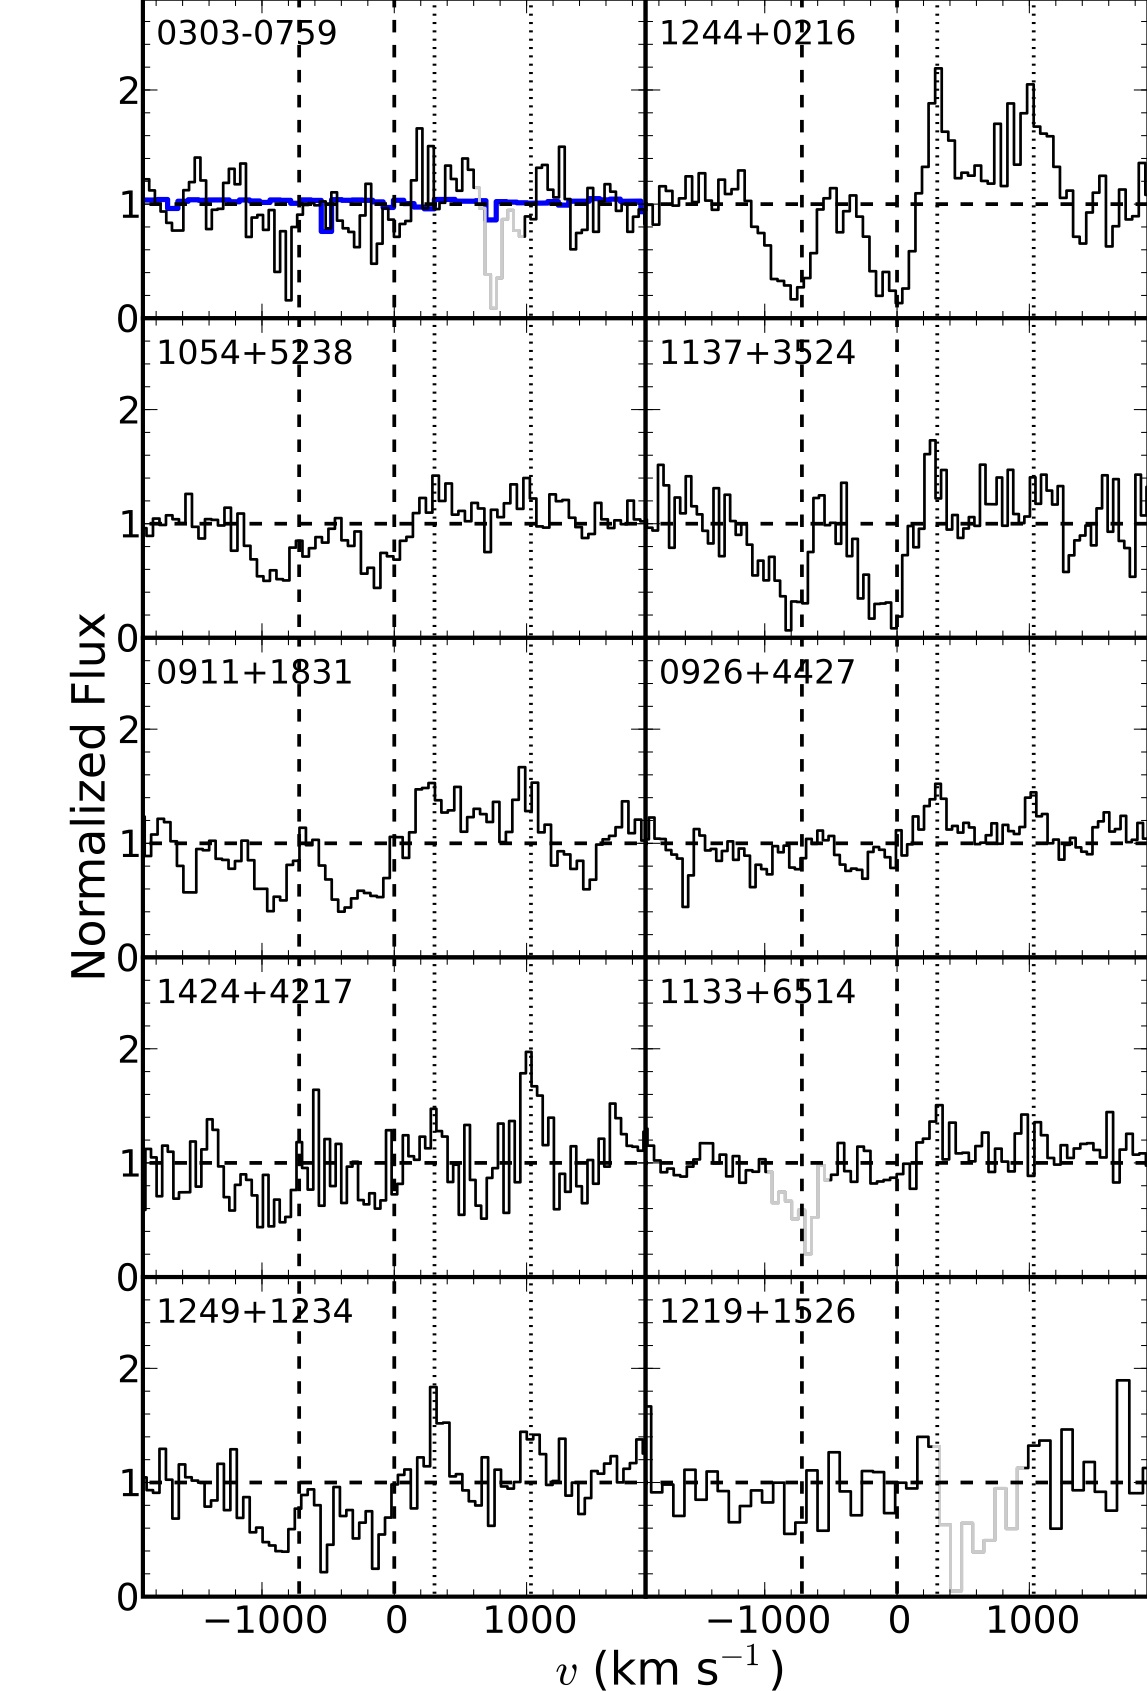
The Si II 1190, 1193 absorption lines are shown for the Green Peas. The velocity scale is defined for the 1193 line, so the 1190 line appears at v~700 km/s, but it is really v~0 for this line. The dashed lines show the systemic velocity. The dotted lines mark the location of emission features, for which discussion is beyond the scope of this post. Grey shaded regions mark bad parts of the spectra. Finally, the blue line in the top left panel shows that the spectrum of stars cannot produce these features. One ion, Si II, with lines at 1190 and 1193 A, is shown here. We measure the Doppler shift between v~0 and the absorption of the lines, in order to determine the characteristic velocity of the outflowing gas. Doing this for Si II, C II, and Si III shows no evidence for a correlation between velocity and outflows. However, one thing is worth noting– all of the Green Peas have outflows and all of them have Lyα. To my knowledge, Lyα emission has not been observed from a galaxy without outflows. So ultimately, Doppler shifting in an outflow may be necessary. But it is certainly insufficient to explain the variation in Lyα escape that we see.
- Finally, we also considered whether the Lyα was getting out through holes in the gas. One way we estimate the scale of such holes is by looking at the “depth” of the absorption lines. If the lines go to zero, then there cannot be any gaps in the absorbing material. But if they don’t go to zero, then it is possible that only a fraction of the stellar light is covered by absorbing material In particular, 1244 and 1137 reach nearly zero, and we would estimate that they have high covering fraction. On the other hand, 1133 and 1219 have no detectable absorption in their SiII and C II lines, so they should have very low covering fraction. The key thing here is that the C II and Si II act as a probe for HI gas that is scattering Lyα, so we are using these metals to get at the amount of HI that covers the stars (and inner regions where Lyα is created).

This plot is similar to the Si II absorption line spectra, but instead it shows Lyman beta or gamma, which probe HI absorption. The difference is remarkable, in the sense that the HI absorption is strong, and reaches zero intensity (or nearly so) for all of the Green Peas. But the Green Peas have something else special that high-redshift galaxies do not: HI absorption line spectra. And behold, the line profiles shown here are uniform in their depth. In short, there is HI gas everywhere. The variation in Lyα cannot be caused by variations in HI gas holes, because there are no holes.

So there we have it: the Lyα gets out of Green Peas because of varying HI density. We see no evidence that dust, outflow kinematics, or HI gas covering play a significant role in regulating the escape of Lyα photons.
So the next question is, what causes the variation in HI density? And how can the HI gas show complete covering, but the metals perhaps do not? Can we use a computer simulation to model the Lyα emission lines, and then can this be used to estimate the amount of gas mass in the halo of the galaxy? These are important questions which we will be investigating next with this sample.
