When the original Green Pea study was published back in 2009, it was pretty obvious to a lot of people that they might be good analogs for typical galaxies that existed when the Universe was much younger. If true, that turns out to be pretty exciting, because the Green Peas are much, much closer. Therefore, if we study the Green Peas in great detail, maybe we’ll learn something about the most distant galaxies in the Universe. Lets first look at how the Green Peas seem similar to galaxies at large cosmological distances.
So how are these Green Peas like high redshift galaxies?
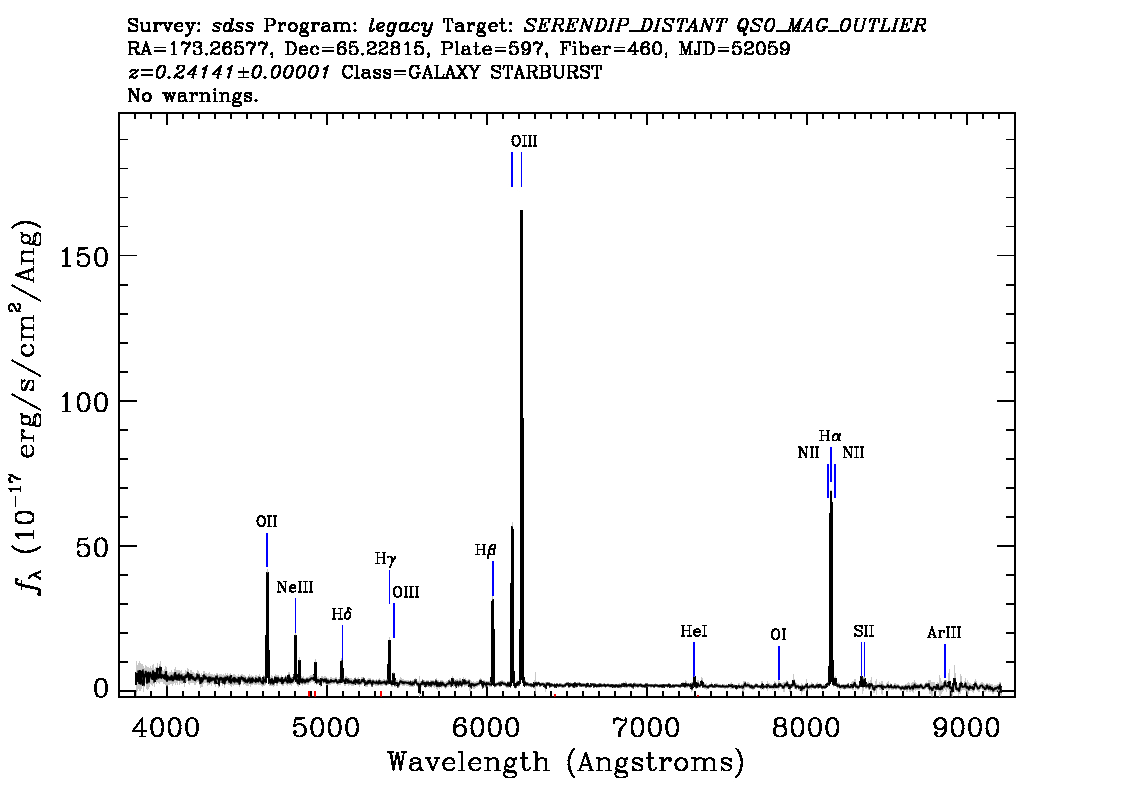
- The Green Peas have emission line equivalent widths consistent with some of the highest redshift galaxies ever observed. The thing about the Green Peas that makes them green is their extremely strong emission lines. Below, an example SDSS spectrum shows how strong the lines are. Since these features originate in gas that is ionized by young, hot stars, we conclude that there is quite a lot of star-formation ongoing in the Green Peas. On the other hand, the underlying continuum comes primarily from the older, longer-lived stars, and can be used as a proxy for the total stellar mass.

This SDSS spectrum of a Green Pea galaxy shows strong emission lines from gas ionized by young stars. In normal galaxies that don’t appear so green, the contrast between the lines and continuum (a.k.a equivalent width or EW) is lower. Normal galaxies in the local Universe have a range of EW, but 10 times lower would be typical. However, for the most distant galaxies, observed in the first billion-ish years of galaxy evolution, it turns out that this kind of high, Green Pea-like EW might be the norm rather than the exception. This finding, while really neat, is not based on spectra, but only images. In the work highlighted below, a galaxy at z~8 is modelled from the flux measured in its images (plotted as red points). In order to best interpret these measurements, the observers fit a model that is comprised of the summed light of stars.

These images of a high-redshift record holder show Green Pea-like properties. The measured flux in each band (shown in red below) is fit with a composite stellar population (blue). Strong emission lines must be included in the model to obtain a good fit. The figure is from a study lead by Pascal Oesch. To get a good fit to the data, the models also have to also include the emission lines. Just like the Green Peas, the lines are so strong that they change the colors that we see in images. Except unlike the Green Peas, for galaxies at such high-redshifts, we cannot take a spectrum like the Green Pea spectrum shown above. Such observations are not possible because very distant galaxies are too faint, and their strongest spectral lines are Doppler shifted to unfavorable wavelengths. However, the James Webb Space Telescope, set to launch in 2018, will be able to take spectra of these high-redshift versions of Green Peas.
- The Green Peas also have low metal abundances. By constructing ratios of the various line fluxes in the Green Pea spectra, we can calculate their metal abundances. Now, it turns out that galaxies near and far show a correlation between metal abundance and stellar mass.

The gas-phase metallicity of galaxies (12+log O/H) correlates with the stellar mass. But Green Peas (green points) sit below the relation defined by normal local star-forming galaxies (grey points). This plot is taken from a study by Ricardo Amorin. The reasons for this mass-metallicity relation are understood (broadly speaking), and we also know that it evolves with redshift. So at earlier cosmic times, when stars hadn’t made as many metals, galaxies had lower metallicities. The funny thing about the Green Peas is that they fall below the mass-metallicity relation, more or less consistent with high-redshift galaxies. This makes Green Peas great local laboratories for studying low metallicity astrophysics that is probably important in distant galaxies.
- The Green Peas have weird line flux ratios, just like galaxies at z > 1-2! And just like at these higher redshifts, nobody knows why. If we construct ratios of the emission line fluxes in the spectrum shown above, we can learn about conditions such as temperature, density and metallicity of that gas. And we can also count the number of ionizing photons to estimate the number of young stars and the rate at which they are forming. We can even figure out if the ionization source is not stars at all, but rather a massive black hole known an Active Galactic Nucleus (AGN). One of the key diagnostic diagrams for sorting out these things is called the BPT diagram, after its original creators. This diagram compares line fluxes in ionized gas probed by [NII], Hα, [OIII], and Hβ. An example is shown below:


In this plot, the locus of measurements seen for normal galaxies is illustrated by contours. This shows where the vast majority of SDSS galaxies lie. The two solid lines show different ways to identify AGN, which occupy the spur towards the upper right. But interestingly, normal star-forming galaxies form a sequence, partly driven by metallicity. Galaxies with gas that is more metal rich move along the sequence towards the lower right, and galaxies that are more metal poor move along the sequence towards the upper left. UV luminous galaxies in the SDSS, which have been studied as possible high-redshift analogs, seem to fall nicely along this sequence. But the Green Peas sit above it, in the same location as high-redshift galaxies! (This has been confirmed in recent studies with better high-redshift data: here and here.) The thing that has astronomers thinking really hard is this: for the vast majority of galaxies in the local Universe, the conditions that give rise to a particular [NII]/Hα ratio will give rise to an easily predicted [OIII]/Hβ ratio. But in Green Peas and high-redshift galaxies, a given [NII]/Hα corresponds to a different [OIII]/Hβ. Hence, something about the gas conditions in high-redshift galaxies and Green Peas must be systematically different than normal star-forming galaxies in the local Universe. But which conditions differ, and by how much? That’s a good question, a source of interesting debates and great fun, which I’ll save for another post.
These are just some of the most obvious observations that make Green Peas an intriguing population. And fortunately, there is a lot more we can learn about them. In upcoming posts, I’ll touch upon even more similarities, and some things that we’re learning from studying the ultraviolet spectra of Green Peas.
