Because galaxies at z>2 have their rest-frame ultraviolet wavelengths shifted into readily observable optical wavelengths, there has been a lot of work in this area for distant galaxies. And it turns out the spectra contain a wealth of information about the gas in galaxies!
The UV spectra are not like the SDSS spectra that probe emission lines. Instead, we mostly detect gas in absorption, usually from the interstellar medium that lies between a galaxy’s stars and our telescope. When we detect this gas in absorption, we can learn a lot about it, including its velocities and ionization state, how much gas there is, how it is distributed in front of the stars, and possibly the rate at which this mass is being expelled from a galaxy. To give an idea of how this works, an example a UV absorption line is shown below.
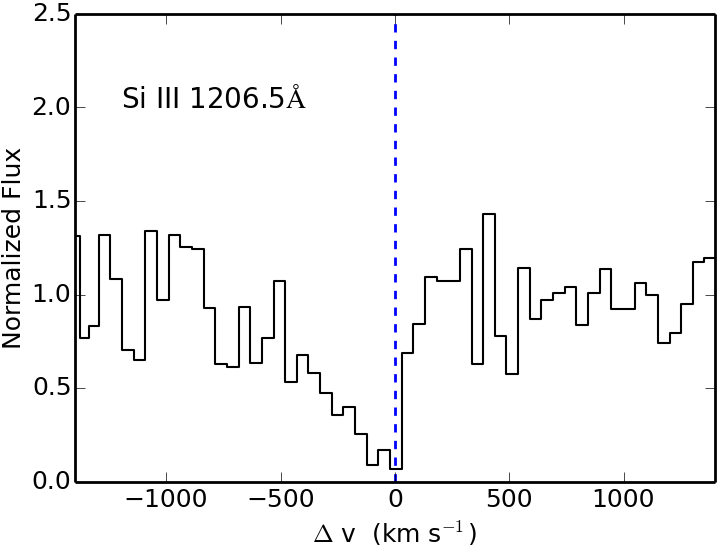
This absorption line is caused by doubly ionized Si. The interesting things about it are:
- Blueshifted absorption probes outflowing gas. The Si III ions absorb photons at 1206.5 Å in their rest-frame. If they are Doppler shifted with respect to the systemic velocity of the galaxy, the absorption will appear shifted. So this spectrum shows that while the deepest part of the absorption appears pretty close to v~0, we see absorption all the way out to at least -500 km/s. Since blueshifted gas is approaching, and the gas must be in the foreground to appear in absorption, we conclude that we are observing gas that is outflowing from the galaxy.
- The spectrum above indicates the presence of relatively highly ionized gas. The ion that I have shown here is from doubly ionized Si. To make this ion requires photons with energies above 16 eV, whereas to ionize hydrogen we only require 13.6 eV. Hence, we expect that in regions where we see this Si III, all of the hydrogen should be ionized. If we compare different ions with different ionization potentials, we can start to get a picture of the ionization state of the gas.
- The absorption goes close to zero near v~0, but not all the way. There are two ways to interpret this observation. On one hand, there may not be enough Si III to absorb all of the UV photons. In this low-density case we refer to the line as optically thin, and we can actually measure the density of Si III atoms. However, it is also possible that the density is much higher in some regions. In this “optically thick” scenario, there is so much Si III that it absorbs all of the light. Normally, we would expect the absorption trough to go all the way to zero for optically thick gas, but if the absorbing gas is dense but patchy then there may be some pathways for continuum light to leak out. For the spectral line above, we can’t tell the difference between patchy and optically thick, or just optically thin. However, sometimes we can use other observations to sort this problem out.
- Sometimes we can figure out the mass-loss rate. If we can measure the density of gas and its velocity from absorption lines, and if we can estimate a size of the galaxy, we can make an estimate of the rate of gaseous mass-loss. Of course, we have to try to estimate the density of all gas, often from just a few metal ions. But this measurement is really important, so we try anyway. If star-formation and the subsequent supernovae eject gas from the galaxies, then this gas can’t form stars. Also, this ejected gas takes metals with it, enriching the space between galaxies (the intergalactic medium). This feedback is invoked in all theoretical galaxy formation simulations, or else they make way too many stars. But the prescription used by the theorists could definitely be improved.
The UV spectra also contain information about gas from their emission; in my next post I’ll explain what we can learn from observations of these features.
